

Austerity comes from the Greek word “austeros,” connoting harsh, bitter, astringency. The first instance of the word to mean fiscal discipline was in 1937, when John Maynard Keynes admonished a fretful President Roosevelt that “the boom, not the slump, is the right time for austerity at the Treasury.”
That view appears to have changed slightly, in the sense that now austerity, even during “the boom,” is suspect. Paul Krugman said, “Slashing government spending destroys jobs and causes the economy to shrink”; Joseph Stiglitz warned that austerity “doesn’t work; it does not lead to more efficient, faster growing economies.”
In an excellent recent book, What Went Wrong with Capitalism?, Ruchir Sharma notes that the standard narrative describing neoliberalism is the systematic “gutting” of government programs, and the imposition of “austerity.” But Sharma goes on to note that the important question is not whether austerity “works,” but whether it even happened.
Sharma is right to ask. With apologies to Musa al-Gharbi, we have never been austere.
US Government Spending, Examined
The complaints of those who decry “neoliberal austerity” center on cutbacks in government spending. A “cut,” to be clear, is when the government spends less in year t+1 than it spent in year t.
Now, it is fair to evaluate such claims on their merits and ask whether cutting back on government spending would be harmful, or might even be beneficial. My purpose here is simpler: I am going to evaluate the empirical claim that government spending has been (I found published examples of all these) slashed, starved, decimated, hollowed out, stripped down, or rolled back.
The US is a federal system, meaning that there are overlapping jurisdictions that have different systems for raising and spending money. So “government spending” is actually separable into two parts: federal, and state/local. I am going to evaluate the claims about austerity by looking at the level of government spending over time.
There are many places to start, but I chose 1960. In that year, the federal government spent $77 billion; in 2025 the amount will be close to $7 trillion. But those are “nominal” or current dollars, and it is misleading to label inflation increases as spending increases. In fact, the austerists might even have a point: if spending rose, but by less than the rate of inflation, that would effectively be a spending cut, in terms of what the money will buy. So I have depicted government spending, both federal (orange line) and state/local (blue line), in constant 2020 dollars.
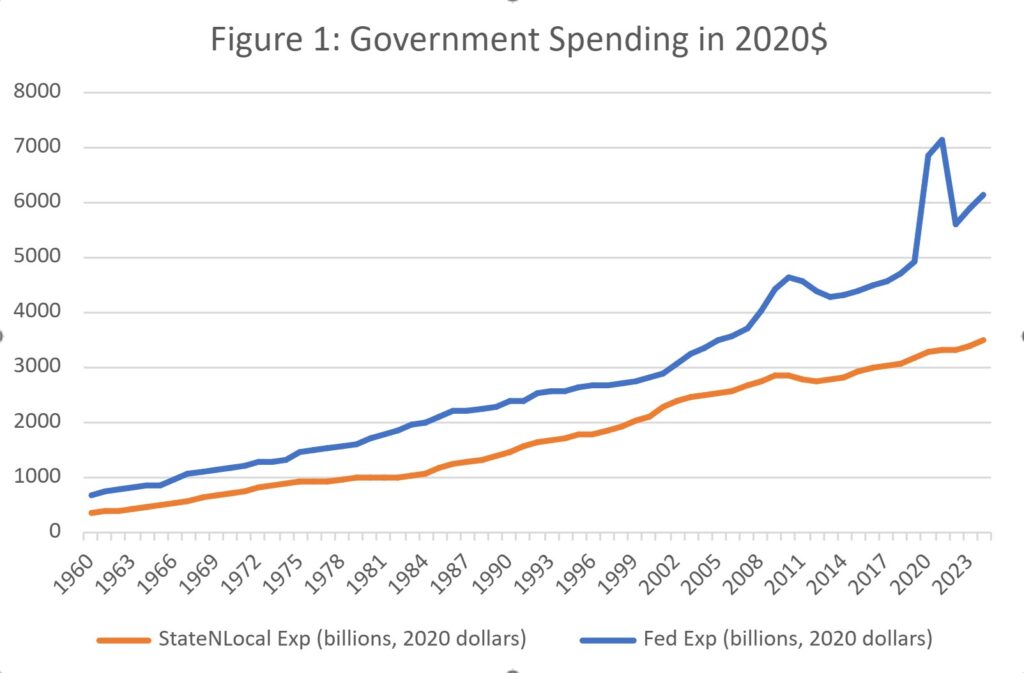
Obviously, controlling for inflation produces no evidence of any kind of cutbacks, or for that matter, a slowdown in growth, for government spending.
Two eras are worth particular note: The Reagan era (1981-1989) and the Obama era (2009-2017). If you took away the horizontal axis and asked someone to pick out the time of the notorious “Reagan government spending cutbacks,” they would certainly not choose the actual Reagan era. There was no cutback in spending under Reagan, at least at the federal level, where the cuts were supposedly so dramatic. And even at the state/local level, the “cuts” were simply a pause in growth, not a reduction.
The Obama era, at least after the financial crisis, did see a pause in spending increases. But remember, these data are controlled for inflation, and for population. There were actually sharp increases in the dollar amounts budgeted; the increases were just less than the trend everywhere else. There are no cuts, never, not anywhere in the whole picture, until the “cuts” resulting from the expiration of the temporary “Carnival of COVID Spending” in 2022.
But (an austerist might object) the population has increased. The true measure of budget cutbacks must account for spending per capita!
I once accepted this argument as valid, but my friend Kevin Grier pointed out to me that it is bizarre. After all, economists usually argue that governments supply public goods, or create a regulatory framework in which other market failures can be corrected. But these activities, by definition, require what economists call “non-rival” consumption. In English, that means that adding more “consumers” does not change the cost of provision of the service. National defense, the “canonical” (get it? Canon?) public good, is entirely independent of the number of people in a given state, or in the country. Defending the territory of the US has nothing to do with the number of people living there. Revenue and tax income can depend on population, but there is no obvious reason why spending has to be “controlled” for population.
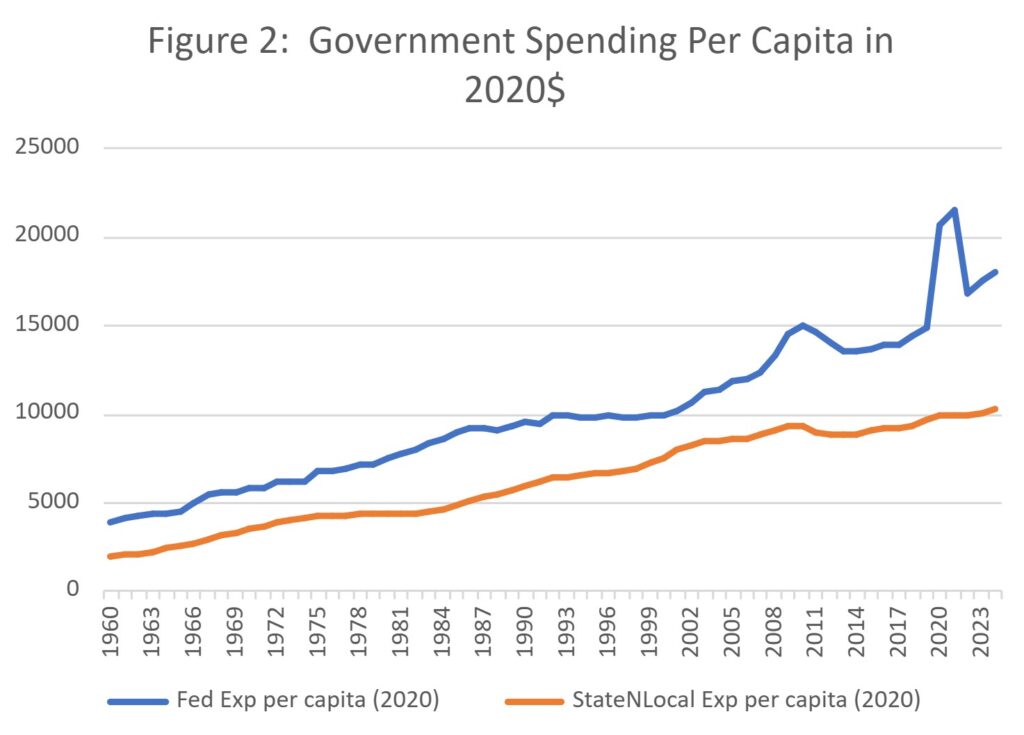
Nonetheless, let’s do this. Figure 2 depicts the history of government spending per capita, 1960–2022, in constant 2020 dollars.
St. Louis Fed. W079RC1A027NBEA (FRED data)
The same basic pattern, of constant increase, is clear. There is absolutely no evidence (none!) of a spending cut, or even a change in the rate of growth, at any point in the supposedly draconian “neoliberal” Reagan-Bush years.
One can imagine the austerist thinking hard now, desperate to save their pet theory of economics, which requires that neoliberalism caused austerity. “AHA! I’ve got it!” our austerist says. “GDP! You have to normalize government spending as a proportion of GDP! Government must have shrunk by that measure!”
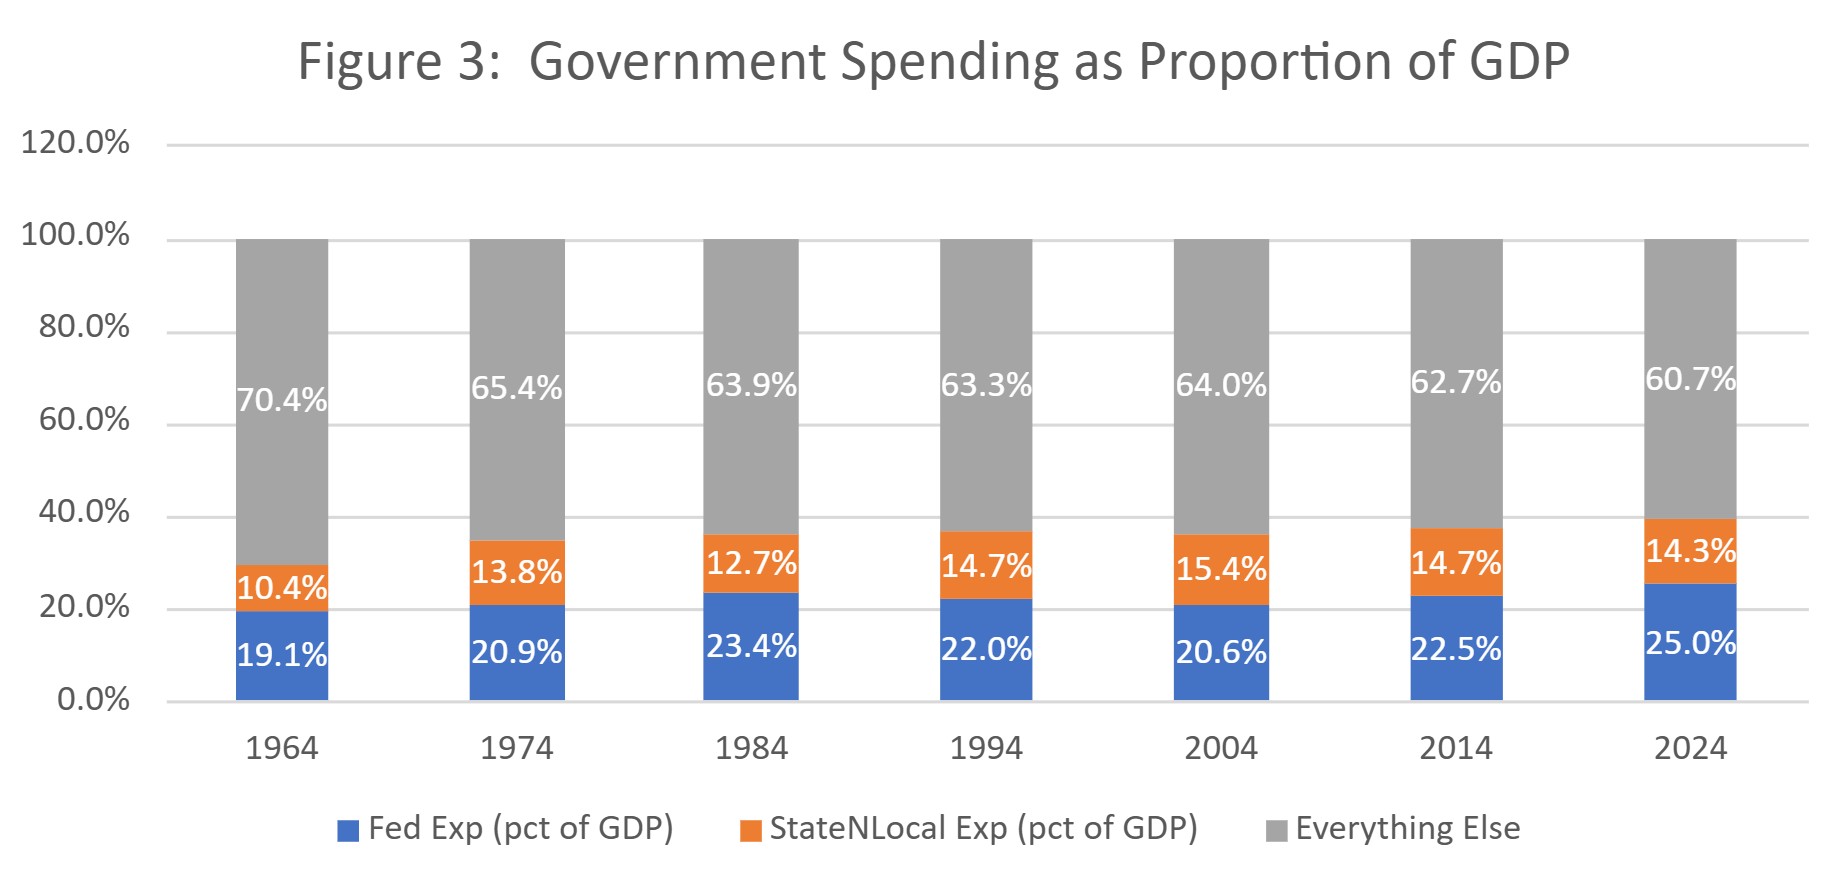
To find out, consider Table 1: a set of stacked bar charts for 1960, 1990, and 2020. The sections of each bar are the percentages of GDP made up of federal, and state/local, government spending.
(FRED data)
Clearly, this measure — which, because it is a percentage at a point in time, also controls for both population and inflation — shows the biggest increase of all. Total government spending was only 30 percent of GDP in 1960, but it is 40 percent (and growing) today.
Now, there are some arguments that government spending of any type doesn’t belong in GDP in the first place. But let’s put that to one side. Government spending has increased, sharply and consistently, for the entire period that is usually labeled as “neoliberal austerity” by critics. That’s true even if you control for inflation, and population growth, and consider spending as a proportion of GDP.
We have never been austere. So why do we hear so much about “austerity”?
Austerity as Sleight of Hand
In fairness, there have certainly been advocates for something like real austerity throughout some of the great economic disruptions of American history. In his autobiography, Herbert Hoover famously quoted Andrew Mellon, then Treasury Secretary, in November 1929 (immediately after the Crash, in October) this way:
[T]he ‘leave it alone liquidationists’ headed by Secretary of the Treasury Mellon, …felt that government must keep its hands off and let the slump liquidate itself. Mr. Mellon had only one formula: ‘”‘Liquidate labor, liquidate stocks, liquidate the farmers, liquidate real estate.’”‘ He insisted that, when the people get an inflation brainstorm, the only way to get it out of their blood is to let it collapse. He held that even a panic was not altogether a bad thing. He said: ‘It will purge the rottenness out of the system. High costs of living and high living will come down. People will work harder, live a more moral life. Values will be adjusted, and enterprising people will pick up the wrecks from less competent people.’
Hoover not only ignored this advice but introduced a flurry of behind-the-scenes spending (as documented by Amity Shlaes) to try to stimulate the economy. Still, because Mellon was the public face of the administration, there is a perception that austerity was tried. It wasn’t.
What is interesting is that the very definition of austerity was changed so that it became possible to point at actual examples. The sleight of hand, which has been noted but not fully understood, is that “austerity” was changed from meaning “cutting the level of government spending” to its current meaning: “cutting the growth in government spending.”
In 1981, there was a famous article in The Atlantic entitled “The Education of David Stockman.” The most important part of that “education” was Stockman having to face the hard truth that a “spending cut” is not reduced spending. It is a reduction in the amount by which spending will be increased in the future. So, if we are scheduled to increase government spending by 10 percent, and we only increase spending by six percent, that is a four percent cut. This question of the definition of a “cut” was central to Congressional politics in the 1990s. In 2011, Stockman noted (correctly) that the supposed $38 billion in “reductions” in the Obama budget were actually a substantial increase.
But no one paid attention. The “austerity” story was too important for the standard narrative of the left. Mike Konczal wrote in Dissent magazine, on January 19, 2017, that “Austerity, both as a practice and as a metaphor, defined the landscape, culture, and politics of the Obama era.” In fact, as we saw in Figures 1 and 2, spending increased substantially between 2009 and 2017, both in real terms and per capita. Politicians made a big show of cutting some of the proposed increases from budgets in 2011, 2012, and 2013, and that version of events has become the widespread perception.
My point is more than simple pedantry. While it is annoying to hear the false “austerity narrative” constantly repeated as Progressive gospel, the real problem is the policy implication. If we permit the “austerity cuts caused poverty, we need to spend more!” fable to become the stylized fact on which policy is based, we will not only be thinking of the wrong solution, but we’ll be working from a false history.